以下の例は、with steps と with fsteps を使い分けてプロットした例です。両者の違いがわかりやすくなるように軸の目盛り等をデフォルトから変えてプロットしています。赤いグラフが with steps 、緑色のグラフが with fsteps を用いてプロットしたものです。
gnuplot> set grid
gnuplot> set xr[0:10]
gnuplot> set xtics 1
gnuplot> set ytics 1
gnuplot> set samples 11
gnuplot> plot x with steps title "steps"
gnuplot> replot x with fsteps title "fsteps"
gnuplot> set xr[0:10]
gnuplot> set xtics 1
gnuplot> set ytics 1
gnuplot> set samples 11
gnuplot> plot x with steps title "steps"
gnuplot> replot x with fsteps title "fsteps"

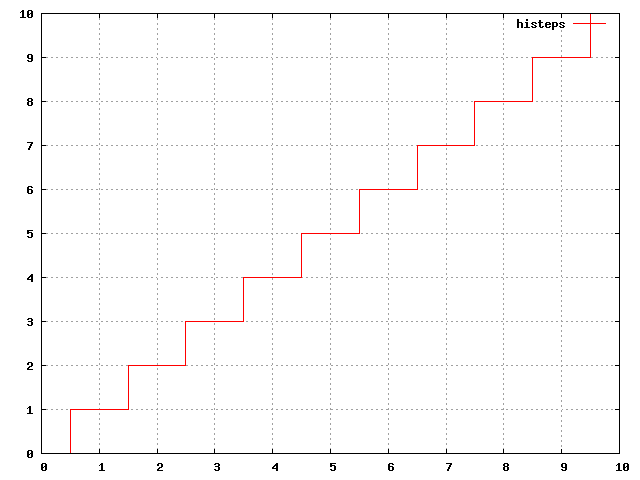
以下は with histeps を用いてプロットしたものです。
gnuplot> set grid
gnuplot> set xr[0:10]
gnuplot> set xtics 1
gnuplot> set ytics 1
gnuplot> set samples 11
gnuplot> plot x with histeps title "histeps"
gnuplot> set xr[0:10]
gnuplot> set xtics 1
gnuplot> set ytics 1
gnuplot> set samples 11
gnuplot> plot x with histeps title "histeps"